Transit Use 2017
04 January 2018I continued to keep track of all the times I used transit in 2017 and have been doing it since 2014. This does not include my transit use in other places. I took 261 rides in 2017. When I have a day pass a “ride” is counted whenever I would be charged if I tapped my Presto card or deposited a token. The only time I used tokens this year was to attend a work lunch at the Board of Trade.
data17 %>% group_by(media) %>%
  summarize(TotRides = sum(rides),
            TotCost = round(sum(cost),2))
media             TotRides TotCost
Day Pass                 5   12.50
Day Pass (shared)       33   35.40
Free                     4    0.00
Presto                 217  642.00
Tokens                   2    6.00
My rides were paid for using: Day Passes (38), Tokens (2), Presto (217), and other (4). Presto cost is less than $3 per ride because some transfers by Presto would have been counted as separate rides using tokens.

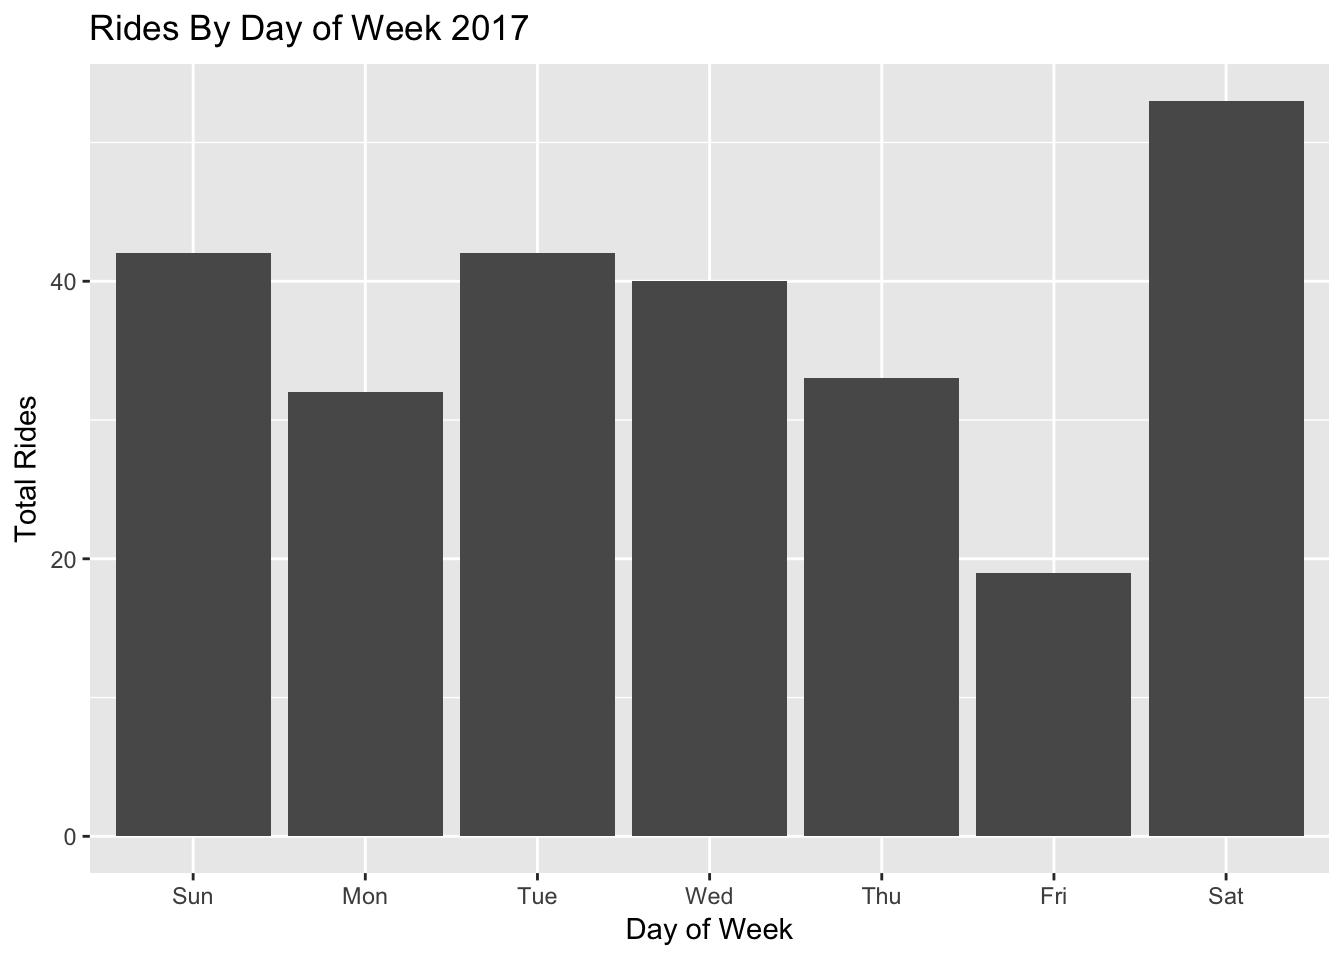
Highest TTC use is again on Saturdays when Day Passes can be shared. I walk to/from work every day when I’m at my regular office so do not use the TTC most weekdays. The higher number of rides Mondays through Thursdays are because I spend June-August going to the airport every day to work.
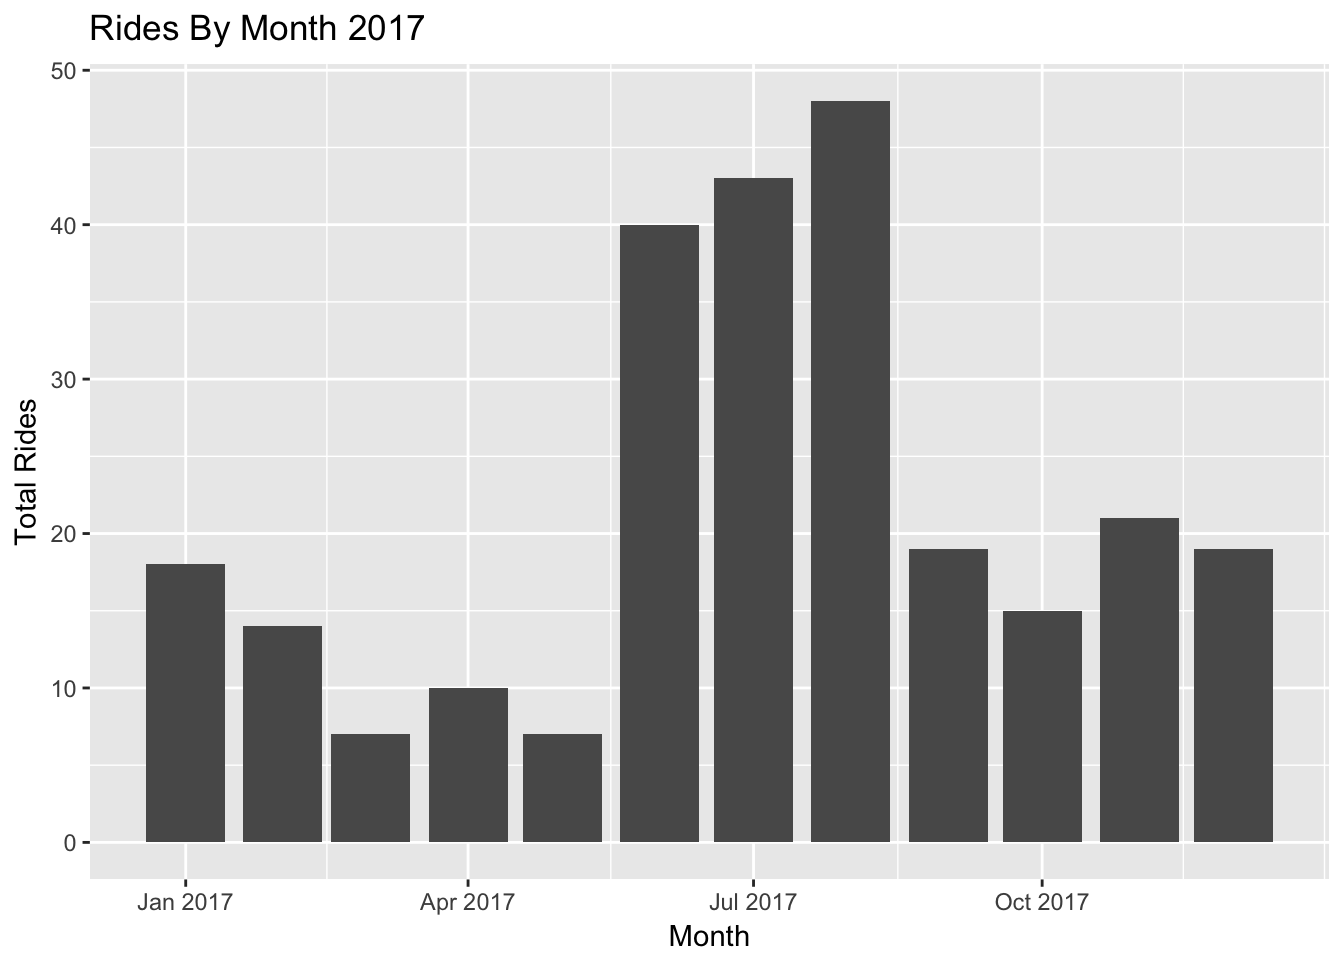
Total rides each month also shows the four day per week I worked at the airport from June to August. The much lower use from March to May happened because I was in Los Angeles every other week.
monthly17 <- data17 %>% group_by(month) %>%
  summarize(TotRides = sum(rides),
  			TotCost = round(sum(cost),2))
p <- ggplot(monthly17, aes(month, TotRides)) +
  geom_bar(stat = "identity") +
  labs(title = "Rides By Month 2017",
  	   x = "Month", y ="Total Rides")
p

Year over year
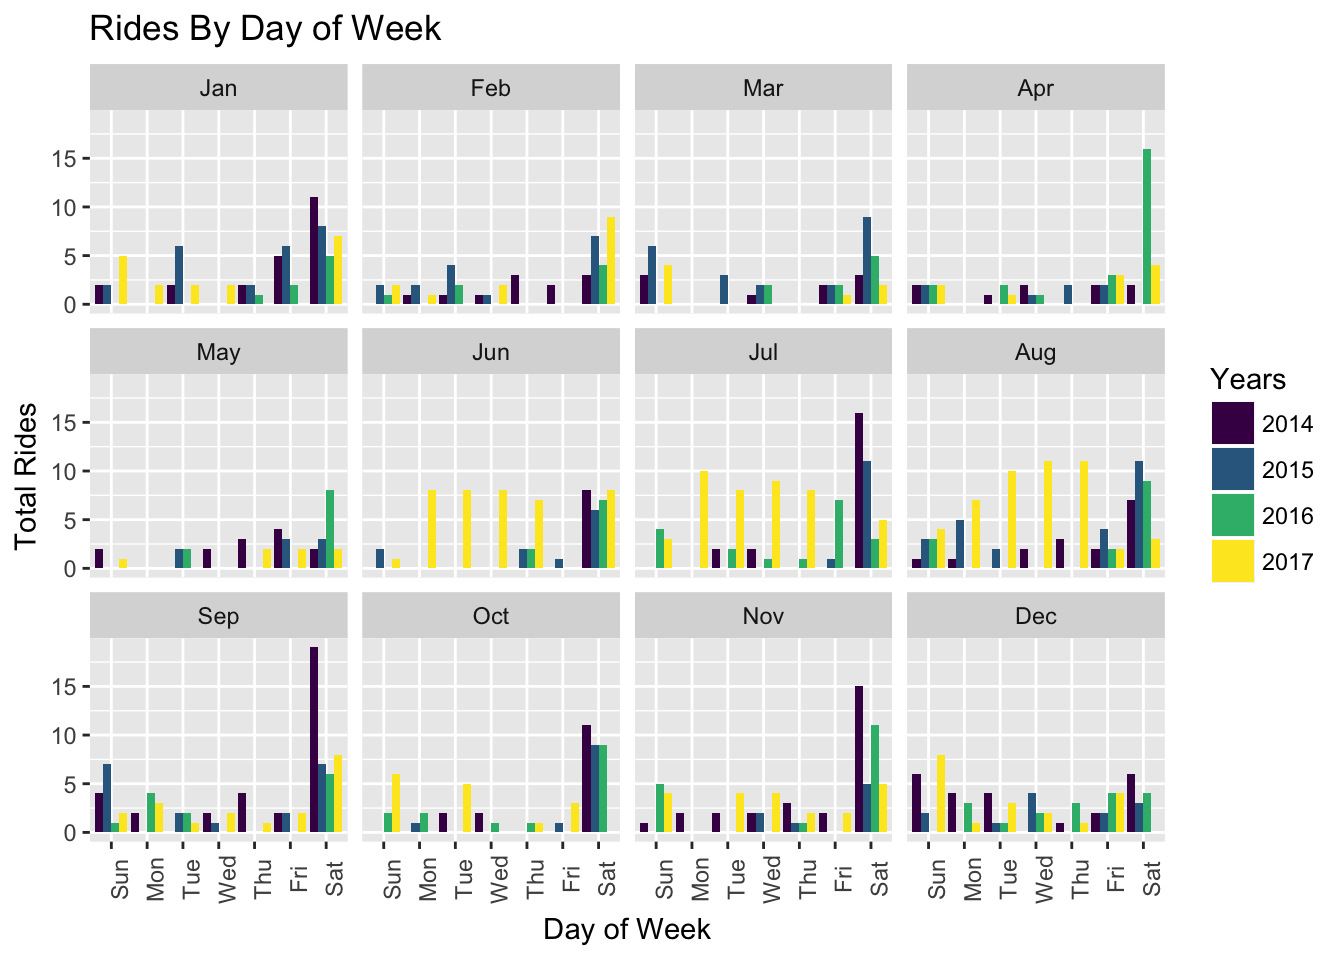
Splitting my day of week out by month for the past four years shows the low weekday pattern in my transit use. Again my secondment to the airport is visible in 2017 breaking the low weekday use pattern.

annual_summary <- data_tot %>%
  group_by(as.factor(years)) %>%
  summarize(Cost = round(sum(cost),2),
            Rides = sum(rides),
            Cost_Per_Ride = round(Cost / Rides, 2),
            Work_Rides = sum((str_count(note, "GTAA"))* rides))
names(annual_summary)[1] = "Year"

annual_summary
Year	Cost 	Rides	Cost_Per_Ride	Work_Rides
2014	379.70    206		1.84          	3
2015   	369.30	  175		2.11          	3
2016    349.68	  161		2.17          	2
2017    695.92	  261		2.67          100
Now that most of my rides use Presto the average cost per ride is increasing. This year, I used the system more than any year since I started keeping track, but only because of work. In prior years, work was never more than a few rides each year.