Transit Use 2022
06 June 2023A bit of a later post on last year’s transit, but better late than never.
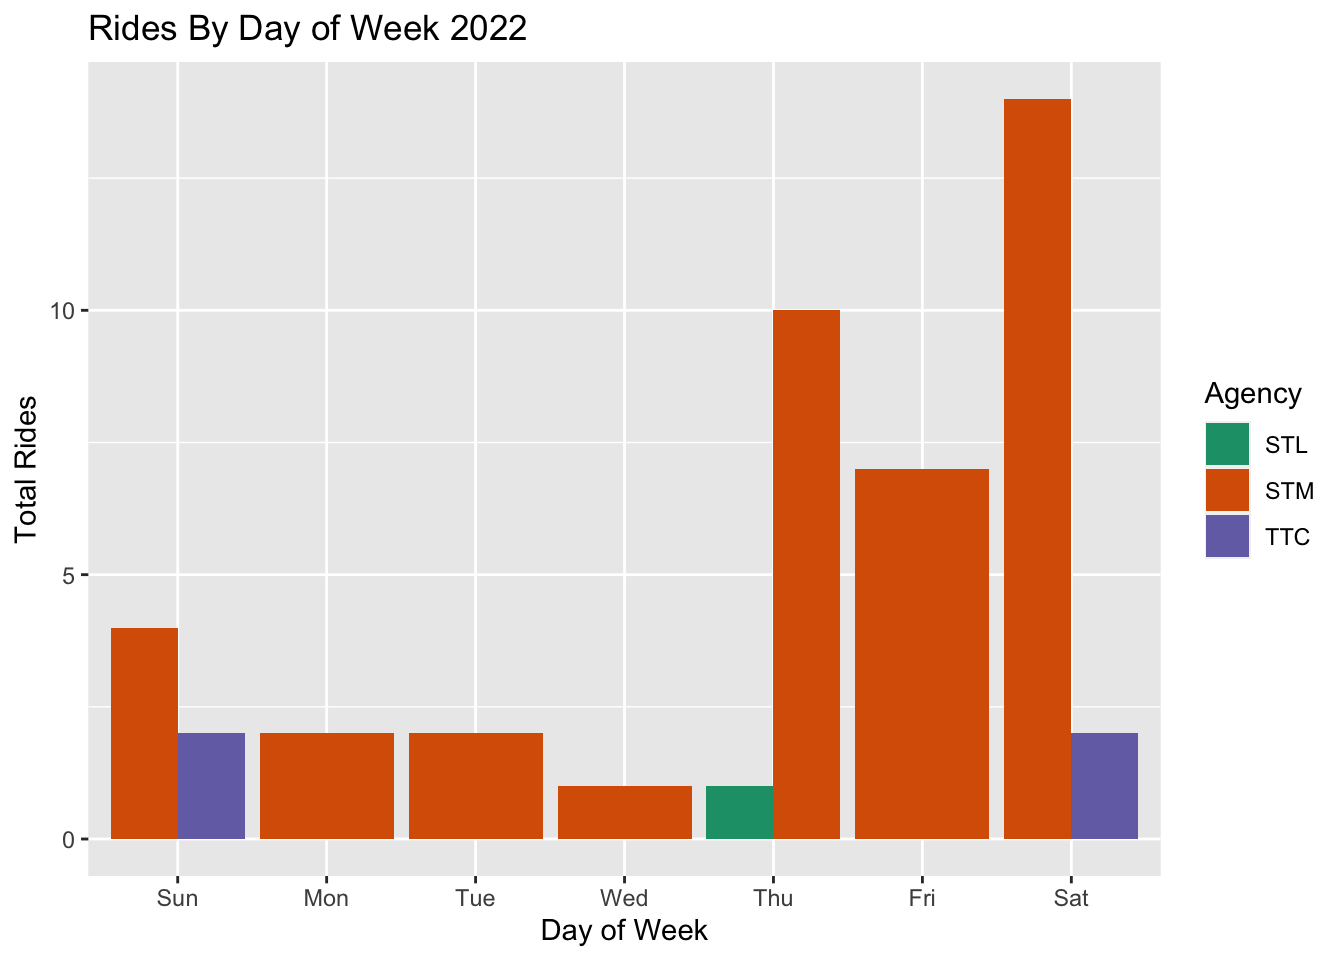
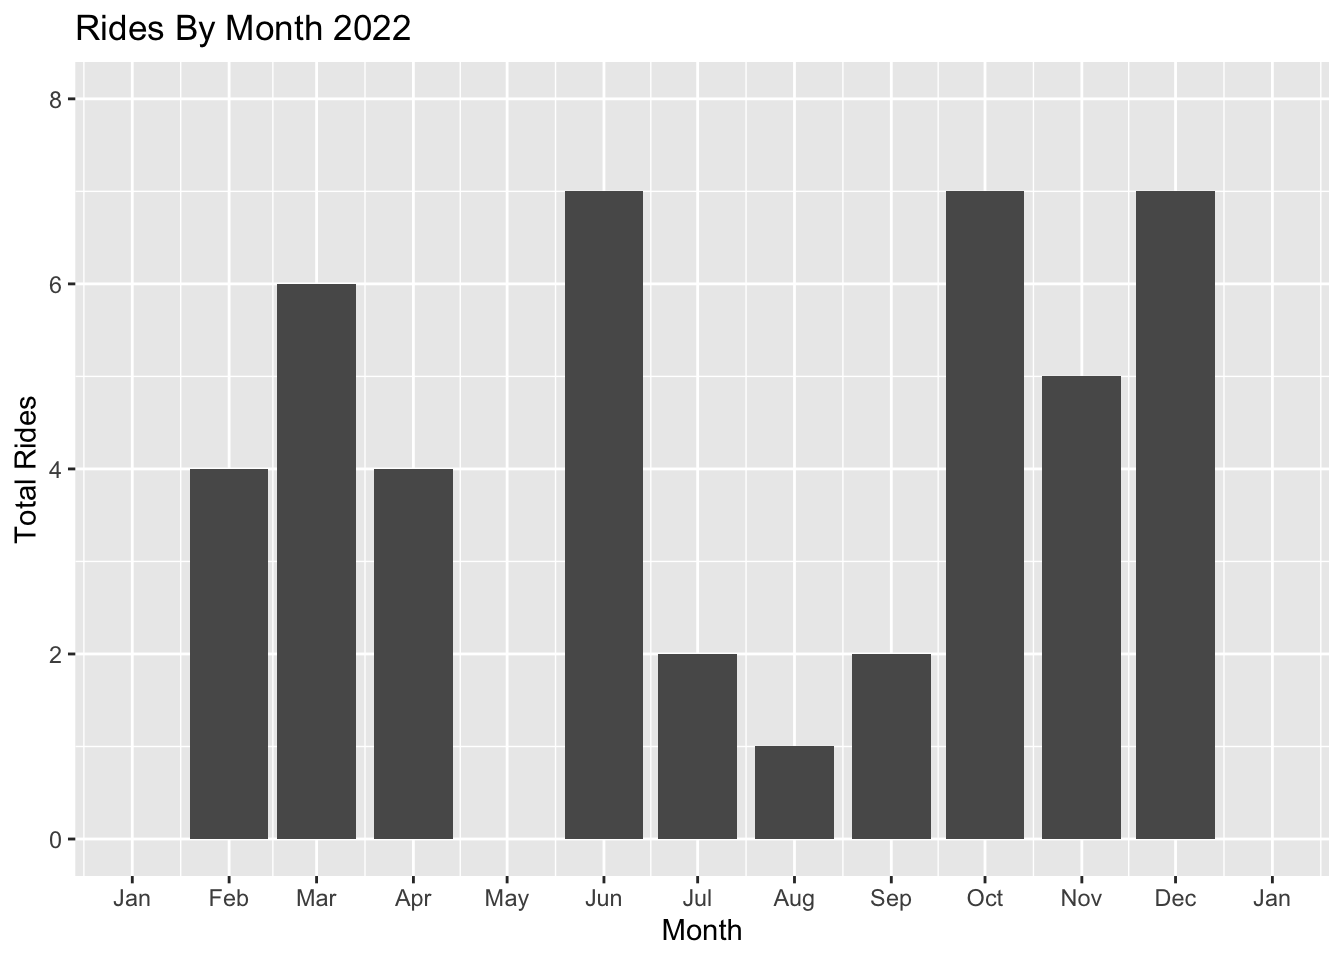
My transit started to rebound in 2022, but I also started biking more often. The tradition of reporting since 2014 continues. I counted “unofficial” transfers on the STM as two rides. I took 45 rides in 2022. My rides were paid for using: Presto (4) and OPUS (41).
| Agency | Fare Media | Total Rides | Total Cost |
|---|---|---|---|
| STL | OPUS | 1 | 4.50 |
| STM | OPUS | 40 | 173.45 |
| TTC | Presto | 4 | 12.80 |

I took more work transit rides in 2022 with some projects restarting at the airport. We took a trip to Toronto in June, and went to friends’ for dinner in Laval.

Year over year
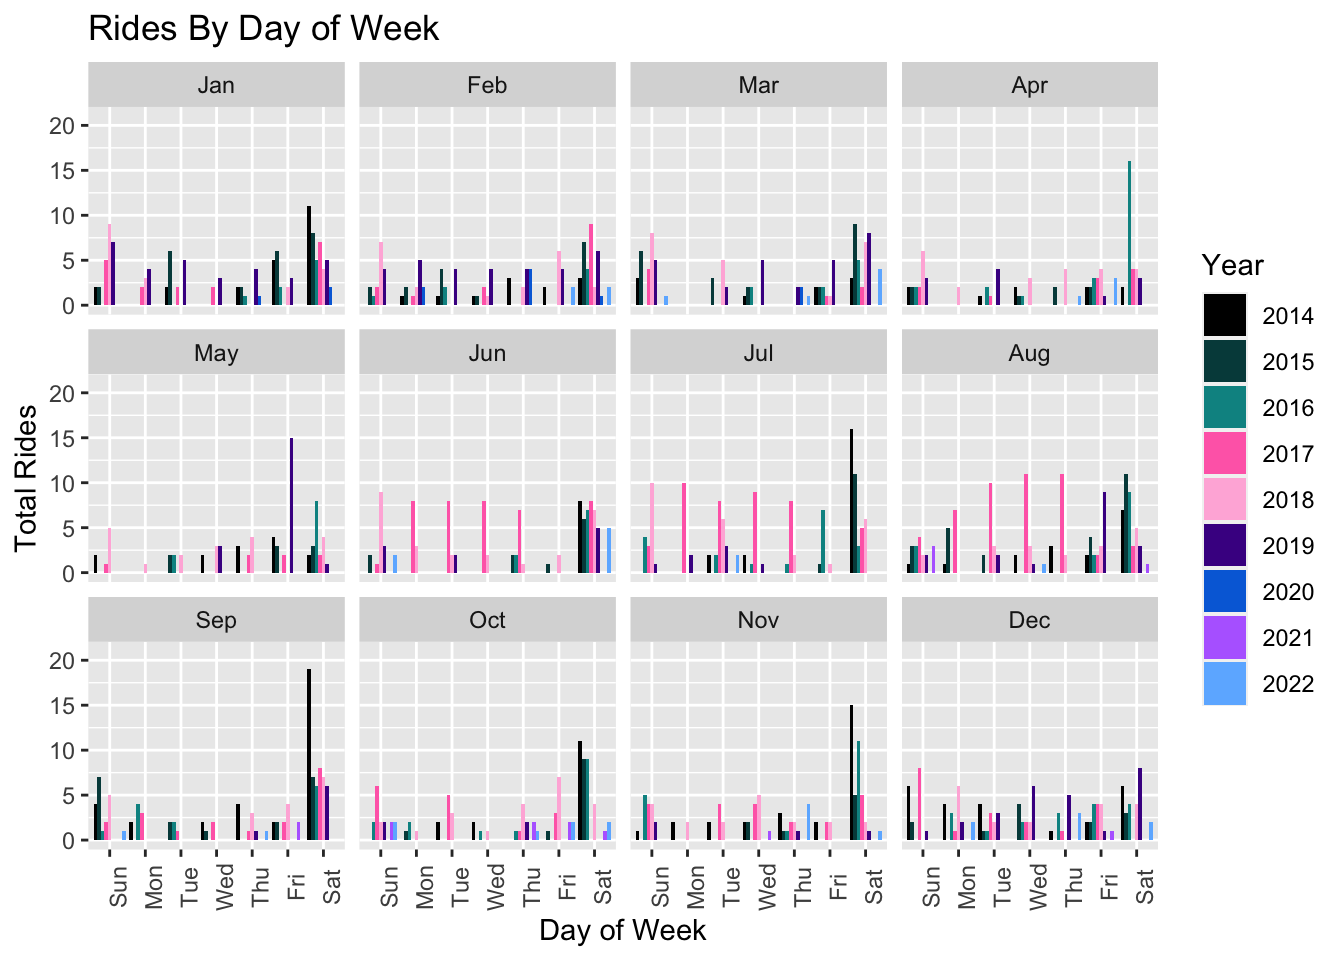
Weekday riding continues to be low (other than in 2017 when I was seconded to the airport for the summer). Historically, I stopped going to axe throwing league on Sundays from September 2018 so no longer have higher riding on that day.

Coming out of the pandemic slowly increased my transit use, but biking on my new cargo bike picked up more of the further away trips.
| Agency | Year | Cost | Rides | Work_Rides |
|---|---|---|---|---|
| GO | 2018 | 20.62 | 2 | 0 |
| MBTA | 2020 | 3.20 | 2 | 0 |
| MiWay | 2018 | 15.00 | 5 | 5 |
| OC Transpo | 2019 | 3.55 | 1 | 0 |
| STL | 2022 | 4.50 | 1 | 0 |
| STM | 2019 | 221.60 | 79 | 10 |
| STM | 2020 | 21.60 | 8 | 5 |
| STM | 2021 | 32.80 | 13 | 0 |
| STM | 2022 | 173.45 | 40 | 6 |
| TTC | 2014 | 379.70 | 206 | 3 |
| TTC | 2015 | 369.30 | 175 | 3 |
| TTC | 2016 | 349.68 | 161 | 2 |
| TTC | 2017 | 695.92 | 261 | 100 |
| TTC | 2018 | 628.50 | 234 | 31 |
| TTC | 2019 | 297.20 | 112 | 5 |
| TTC | 2020 | 3.10 | 2 | 0 |
| TTC | 2021 | 6.40 | 2 | 0 |
| TTC | 2022 | 12.80 | 4 | 0 |
| UPX | 2018 | 56.29 | 7 | 7 |
| UPX | 2019 | 18.50 | 2 | 1 |